
Ancestry.com
DNA Story
A groundbreaking tool to discover, explore and connect to your personal genetic history
︎
Role: Lead Designer
︎
Highlights
︎
Patent Awarded
︎
Significant lift in
NPS, CSAT, & sales
Jump to Final Designs
DNA Story
& Genetic Communities
A groundbreaking tool to discover, explore and connect to your personal genetic history
︎
Role: Lead Designer
︎
Highlights
︎
Patent Awarded
︎
Significant lift in
NPS, CSAT, & sales
Jump to Final Designs

v3 Design
Ancestry’s DNA Story & Genetic Communities is a groundbreaking suite of features that illustrate a user’s unique genetic heritage by highlighting the interplay of people, place and time.
I was a lead UX partner on the team that designed, built and launched this new product in 2017. In addition to improving consumer comprehension and engagement, we also successfully keyed this product to shift away from a single-sale “test-n-result” experience to a sticky, content-consumption subscription experience.
Initially launched to ~3 million users, in its fourth iteration in late 2020 it is currently used by over 8 million.
TechCrunch’s review of the experience:
“Ancestry answered the DNA questions 23&Me couldn’t”
Wirecutter’s review of the experience:
“The Best DNA Ancestry Test”
Project Background
︎
Our genetic team came to us with an opportunity: in the course of refining their ethnicity algorithm, they had more or less accidentally created a proprietary and revolutionary data set that was capable of providing not only genetic ethnicity break downs for an individual, but to link that individual into a genetic community, and to pin-point on the globe where those genetic communities had originated. Our Product Leadership wanted to use this data set to create a ground-breaking, proprietary DNA product.
Business Goals
- Launch differentiated proprietary genetic testing product
- Create a sticky experience to support subscription model
- Repackage low-usage, buried features into a unified experience
- Surface upsell opportunities to engage and retain non-hobbyist users
- Create a sufficiently user specific-experience to sell more units to additional family members.
Experience Goals
- Create an immersive, emotional experience
- Help users contextualize discoveries in a meaningful way
- Leverage geographical-facet to create one-of-a-kind genetic discovery tool.
- Prove value of geographical-facet to product org
We set out to gauge our users’ understanding of this unique value. We created intercepts on our site to surface an opportunity to participate in light weight user-research. We served a ~25 question survey to measure their baseline understanding of their current DNA test results. From there we identified users to interview to probe deeper — asking what information they expected to get from their DNA test and what they wanted to do with it. We also created questionnaires to collect information during convention and expo visits.
Findings:
- Users didn’t understand “when” their ethnicity was coming from — thousands of years ago, or from, say, their great-great grandparents.
- Understanding of global political history and geography was low, and this sometimes resulted in dissatisfaction in results — i.e. users who think of themselves as Italian may be dismayed to get predominately “Greek” ethnicity results.
- Users were unsure in their valuation of near historical findings without major contextual hand-holding — i.e. users were un-likely to value a result that placed their family in the eastern United States 200-300 years ago without that being couched in prestige terms like “founding fathers,” “early colonial settlers,” etc.
- Users didn’t understand how the network of their genetic relatives on Ancestry fit into their results.
- Users had little-to-no mental model of what to do with genetic match results, especially with distant relations; subsequently they placed little value in these results.
- Users placed large personal value in being able to “prove” their connection to ethnic regions.
- Many users of our DNA testing product were visiting Ancestry for the first time, and were unfamiliar with the site and hobby of family history as a whole.
We set up several design sprints to work through our findings. We knew we had too much to pack to one product, so we winnowed our findings down into activities and problems related solely to new or first-time users of DNA ethnic testing.

Problem Statements
- As a new user, I’m unfamiliar with the difference between deep ethnic genetic markers, and markers that link me to more recent events.
- As a user confronted with challenging new information, I need rich context to help me evaluate my results.
- As a user confronted with expected results, I need rich context to feel my results are valuable.
- As a new user, I need help contextualizing my results and understanding what I can do with them.
- As a primarily DNA customer, I am unfamiliar with what else Ancestry can tell me, or what people do on this site.
- As a primarily Family History customer, I am unfamiliar with how to reconcile or combine my research with my test results.
Solution Explorations
It was clear from our research that for users to value, process and utilize anything we could tell them, they would need detailed understanding of the interplay between when, where and what.
We formalized these elements into three relational canvases:
- A geographical canvas: a mapping solution that could begin globally and zero in on custom regions
- A chronological canvas: a timeline that allowed us to anchor results, ancestors, and insights in time
- A discovery canvas: a place to surface multiple types of rich content or data sets.
Synergy!
😬As we worked through potential inputs to the discovery canvas — traditionally confined to genetic matches or broad regional ethnic information — we realized having data & geo data provided an opportunity to surface articles from our historical insights database in a way that would provide useful context. This lead to the realization that this also provided an ideal place to link any nodes from a user’s family tree as well, run interactive campaigns, or serve ads to upsell subscriptions or products: it created a holisitic place to launch your ancestry experience.

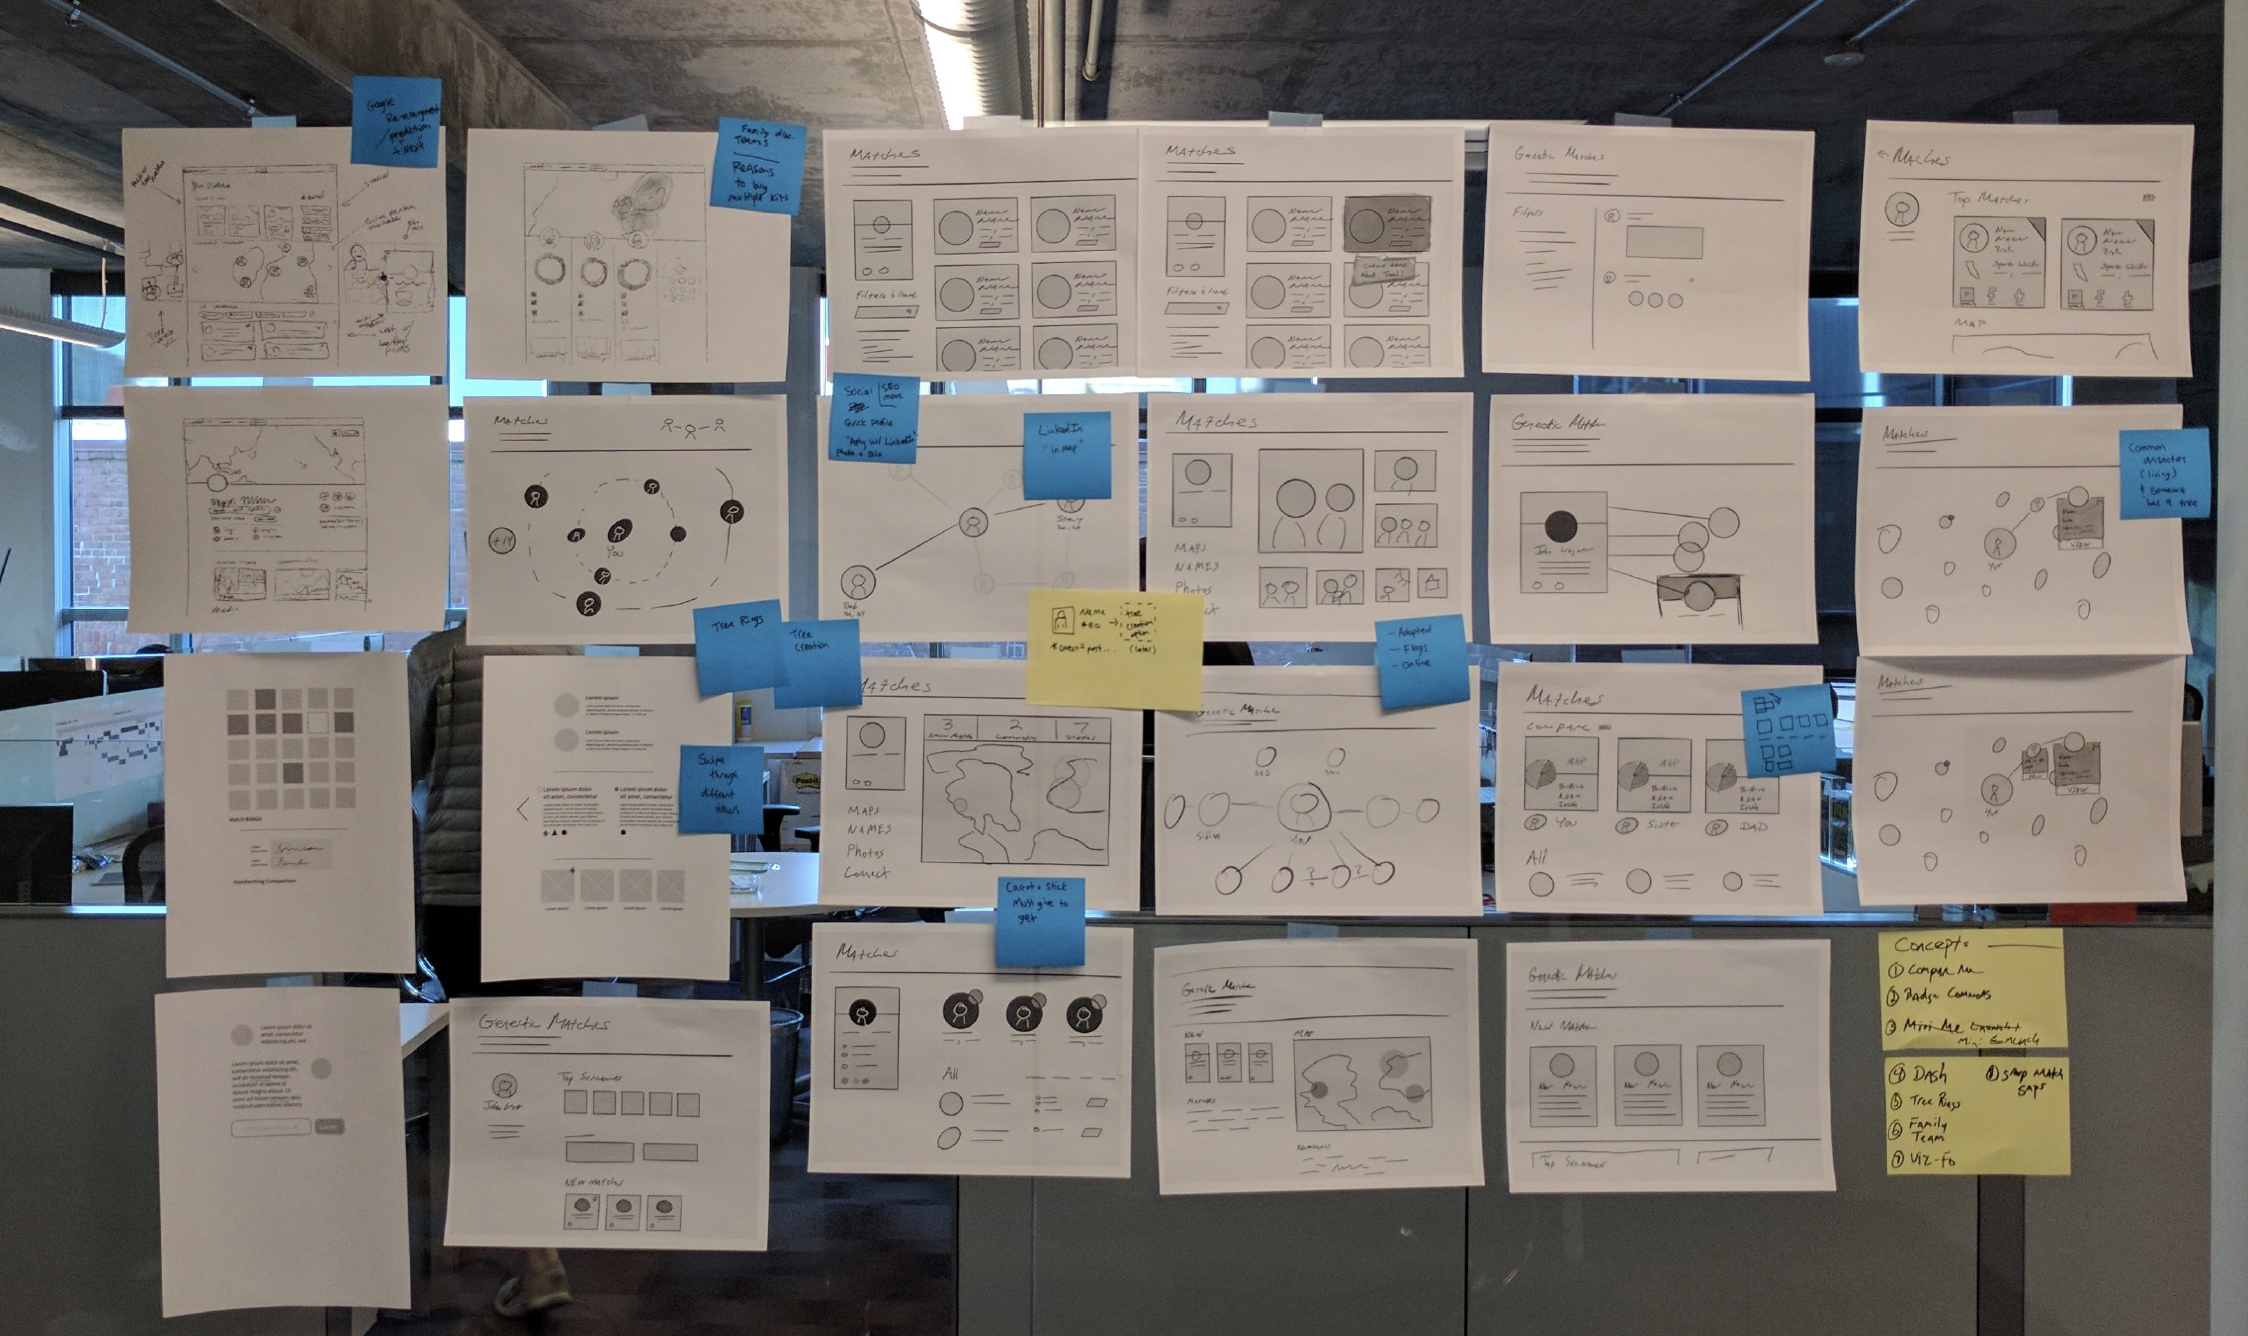
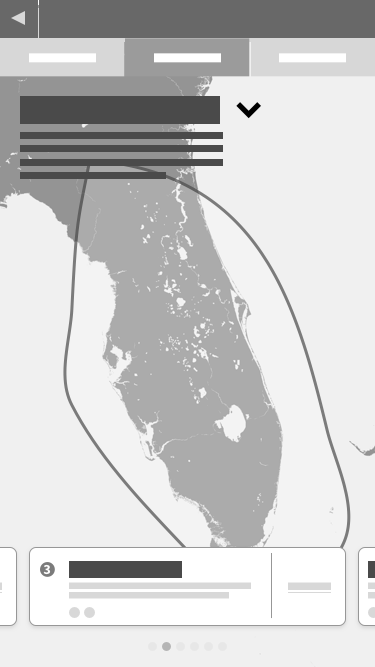
Wireframes & Early Explorations:


Usertesting
Usertesting and usability testing for this product took place over the space of a year. We conducted over 140 multi-hour user interviews across the US and Europe. In addition to navigation, discovery flows, and comprehension testing, we also tested content and creative to gauge interest and trust. We created intercepts to test users who identified with genetic communities where we knew we’d need to be extra critical across these metrics: Enslaved African Americans, Europeans of Jewish Descent, and Native Americans. We partnered with history experts from these communities to author content, source imagery, and test.
V1 Beta
Our initial designs separated our canvases into distinct tabs, hoping to avoid mental overload. We had a pretty prescriptive flow: explore by regions, narrowing from broad areas into specific sub-regions; or explore by timeline, narrowing in from broad spans to specific events. We rolled this beta strategically to 42,000 users for whom we had detailed, rich content; we planned intercepts to poll users on reception, and instrumented help UI to monitor for lifts, and also coordinated with support to sync on top line issues. The overwhelming response was: meh? People weren’t finding the feature, weren’t engaging, or were confused.


This was a sigificant learning experience, that lead to a lot of retooling and refining the user experience. My product manager, Lauren, gave an excellent case study on this stage in the product at 2019’s Front Conference:
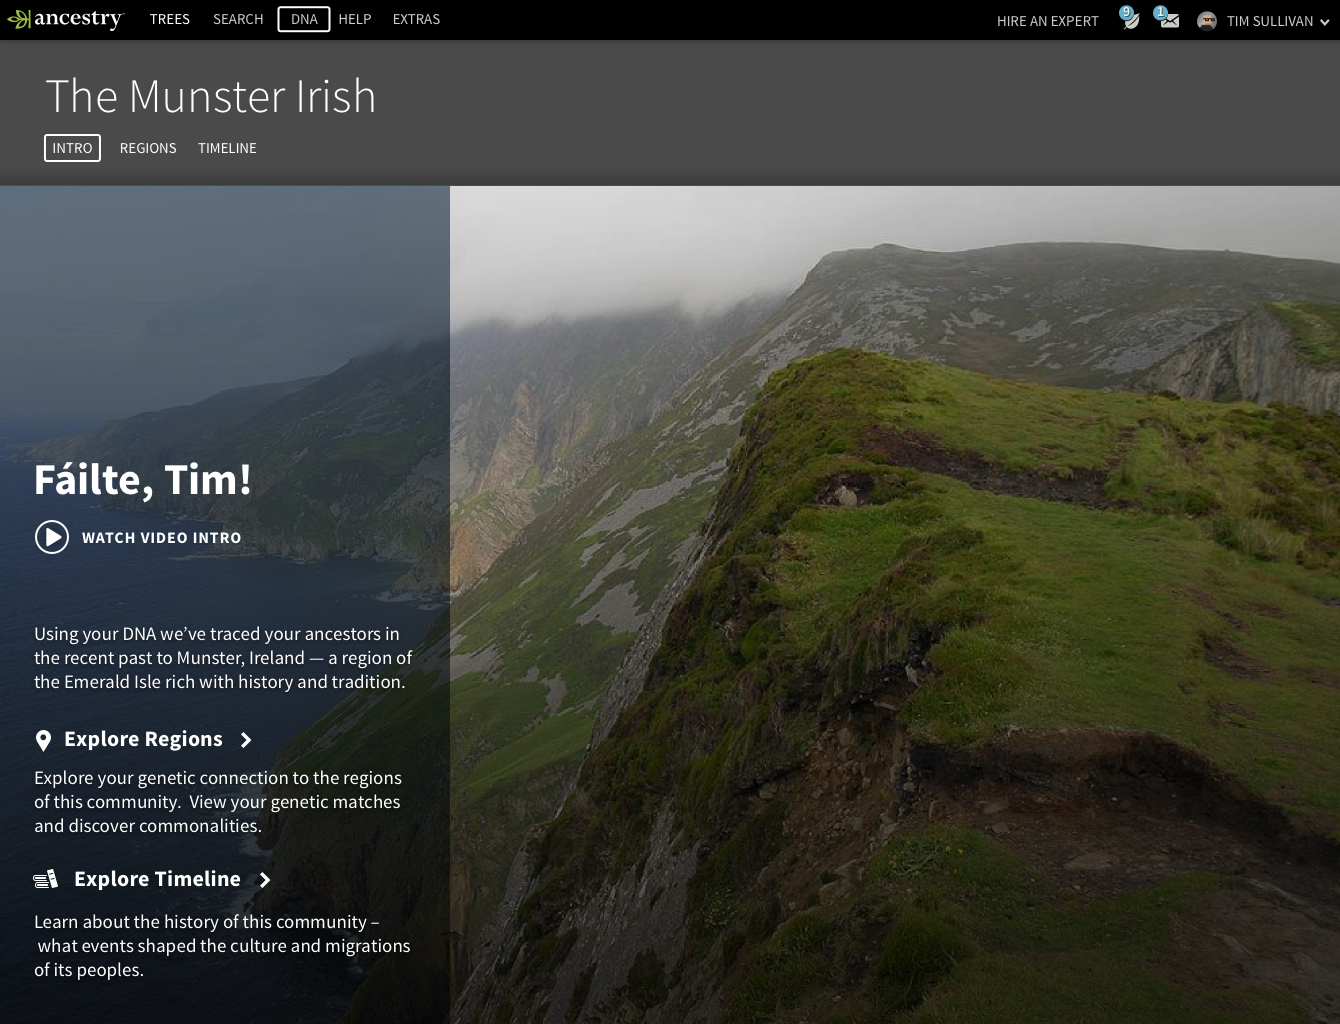
V2 Public Launch:
At public launch, we had refined our canvas layout to facilitate better understanding of the interplay between the canvases, and redesigned the entry point on the DNA homepage. This lead to a 200% NPS lift, a 244% increase in click through into the detailed views (users were engaging with every level of the product) and we saw a 300% increase in year-over-year kit sales over the next two years, and a significant drop in support calls.
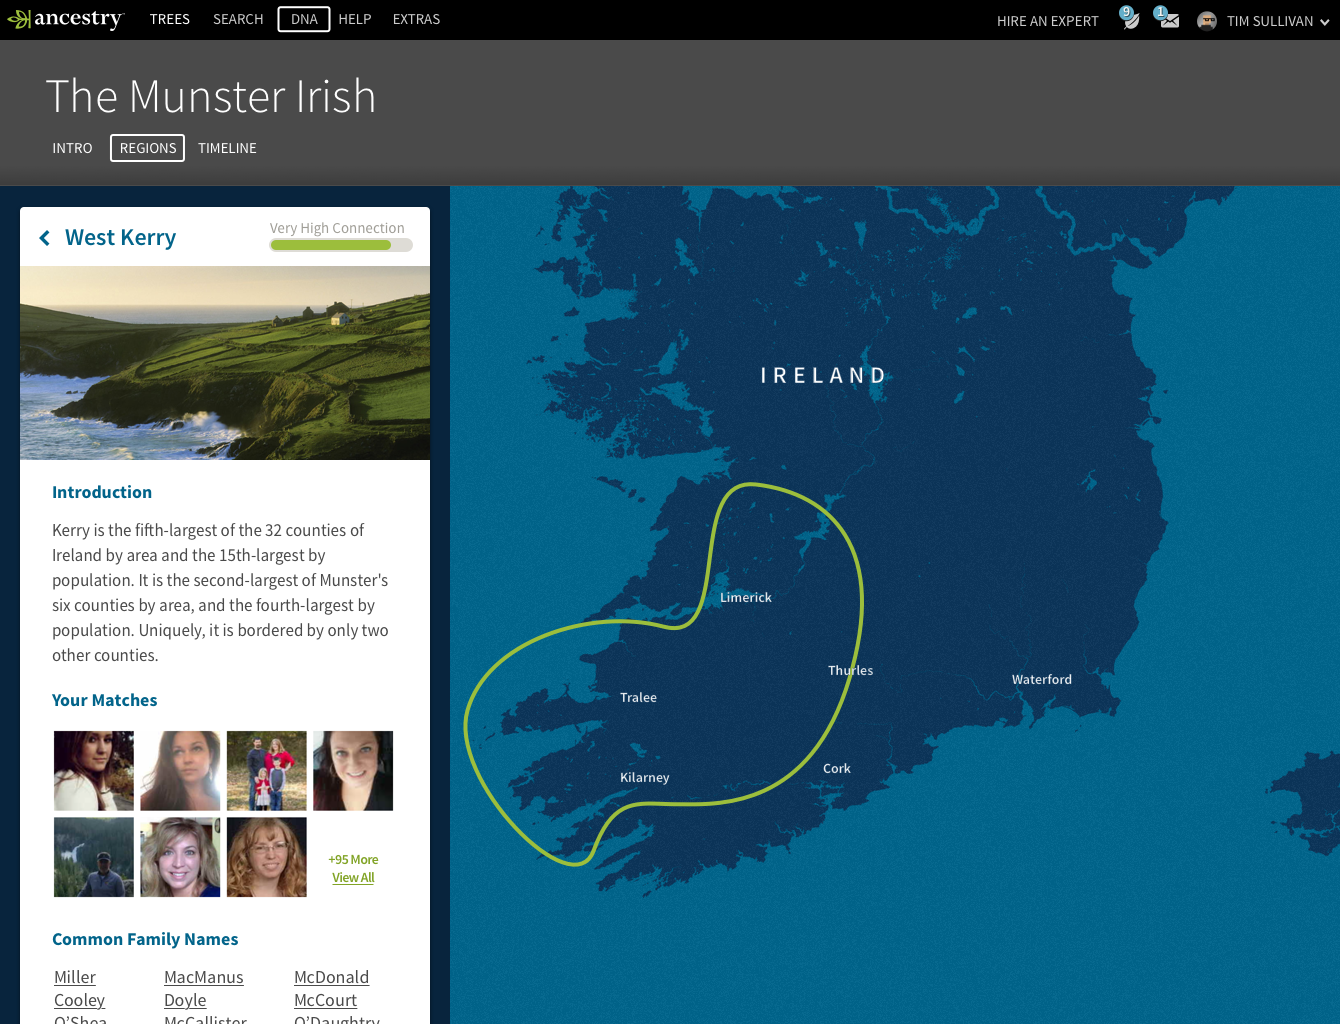
We allowed the users to move freely about the main interface, adjusting all canvases in relation to one another. Zeroing in on a region focused the timeline on that region’s history, and surfaced ancestors that matched both criteria. Focusing on a particular date range gave an overview of each region in that range, and surfaced discoveries related to both.
︎
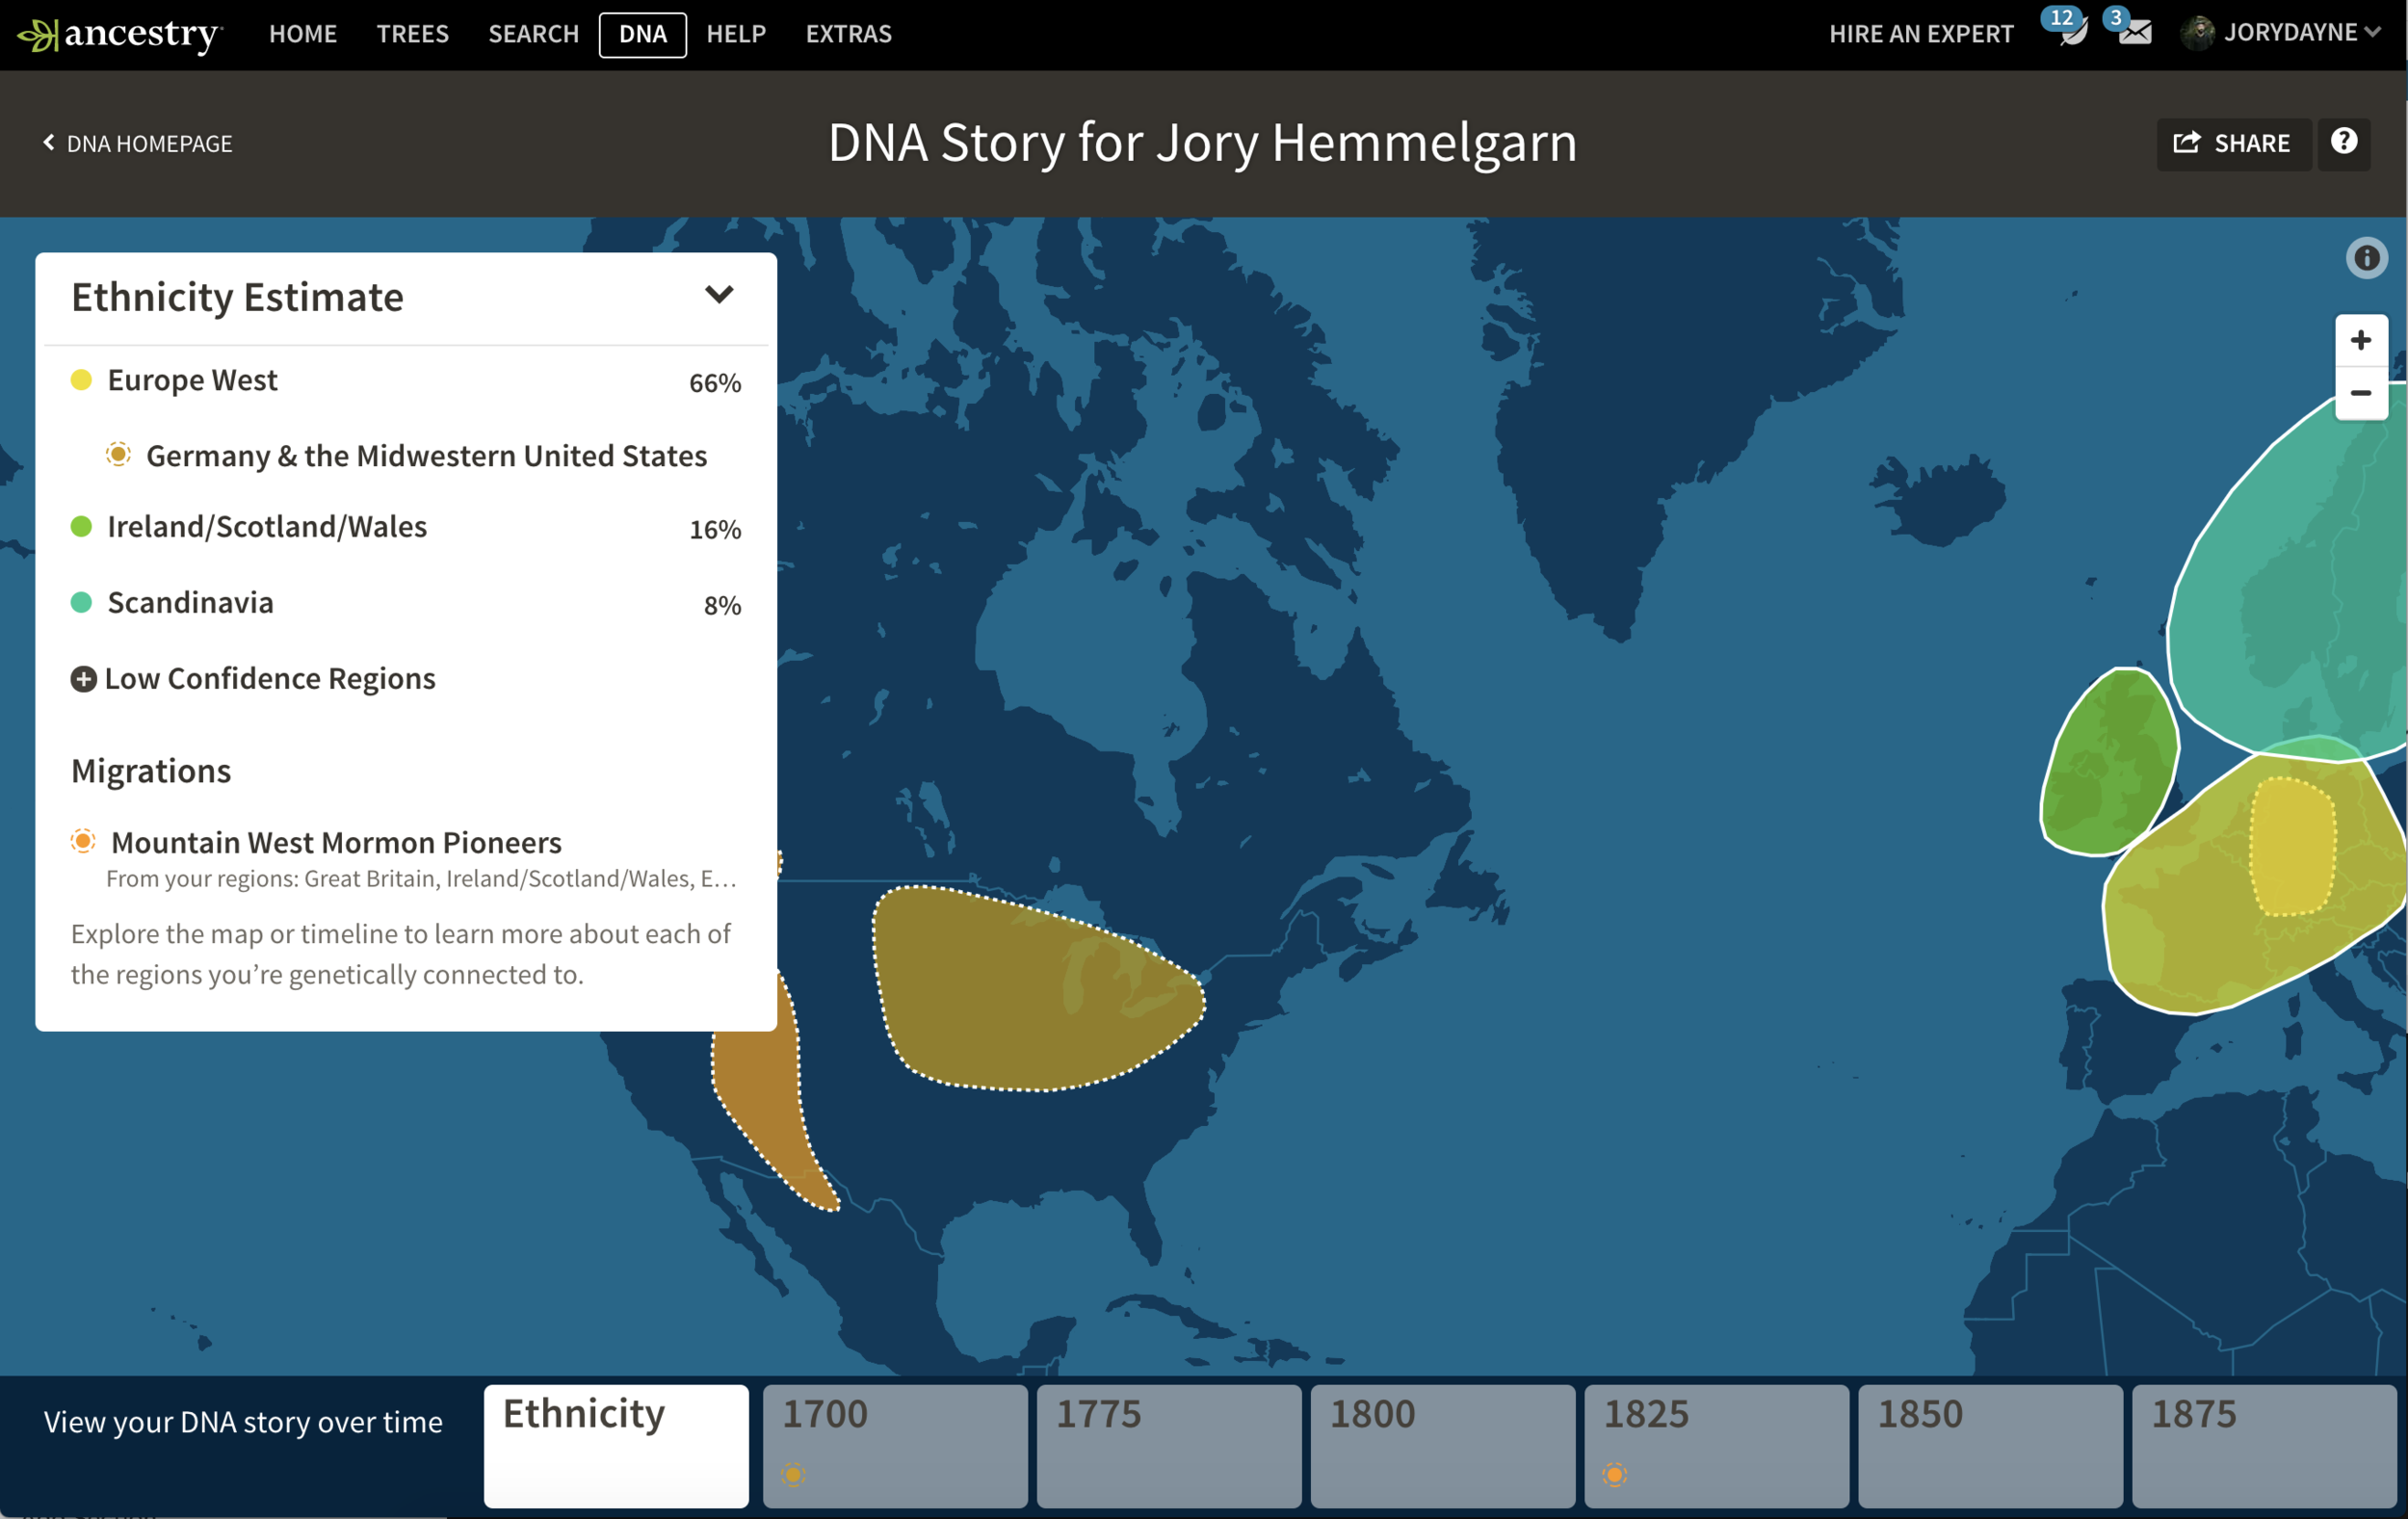
Ethnicity Report with Migrations & Communities

Regional Focus
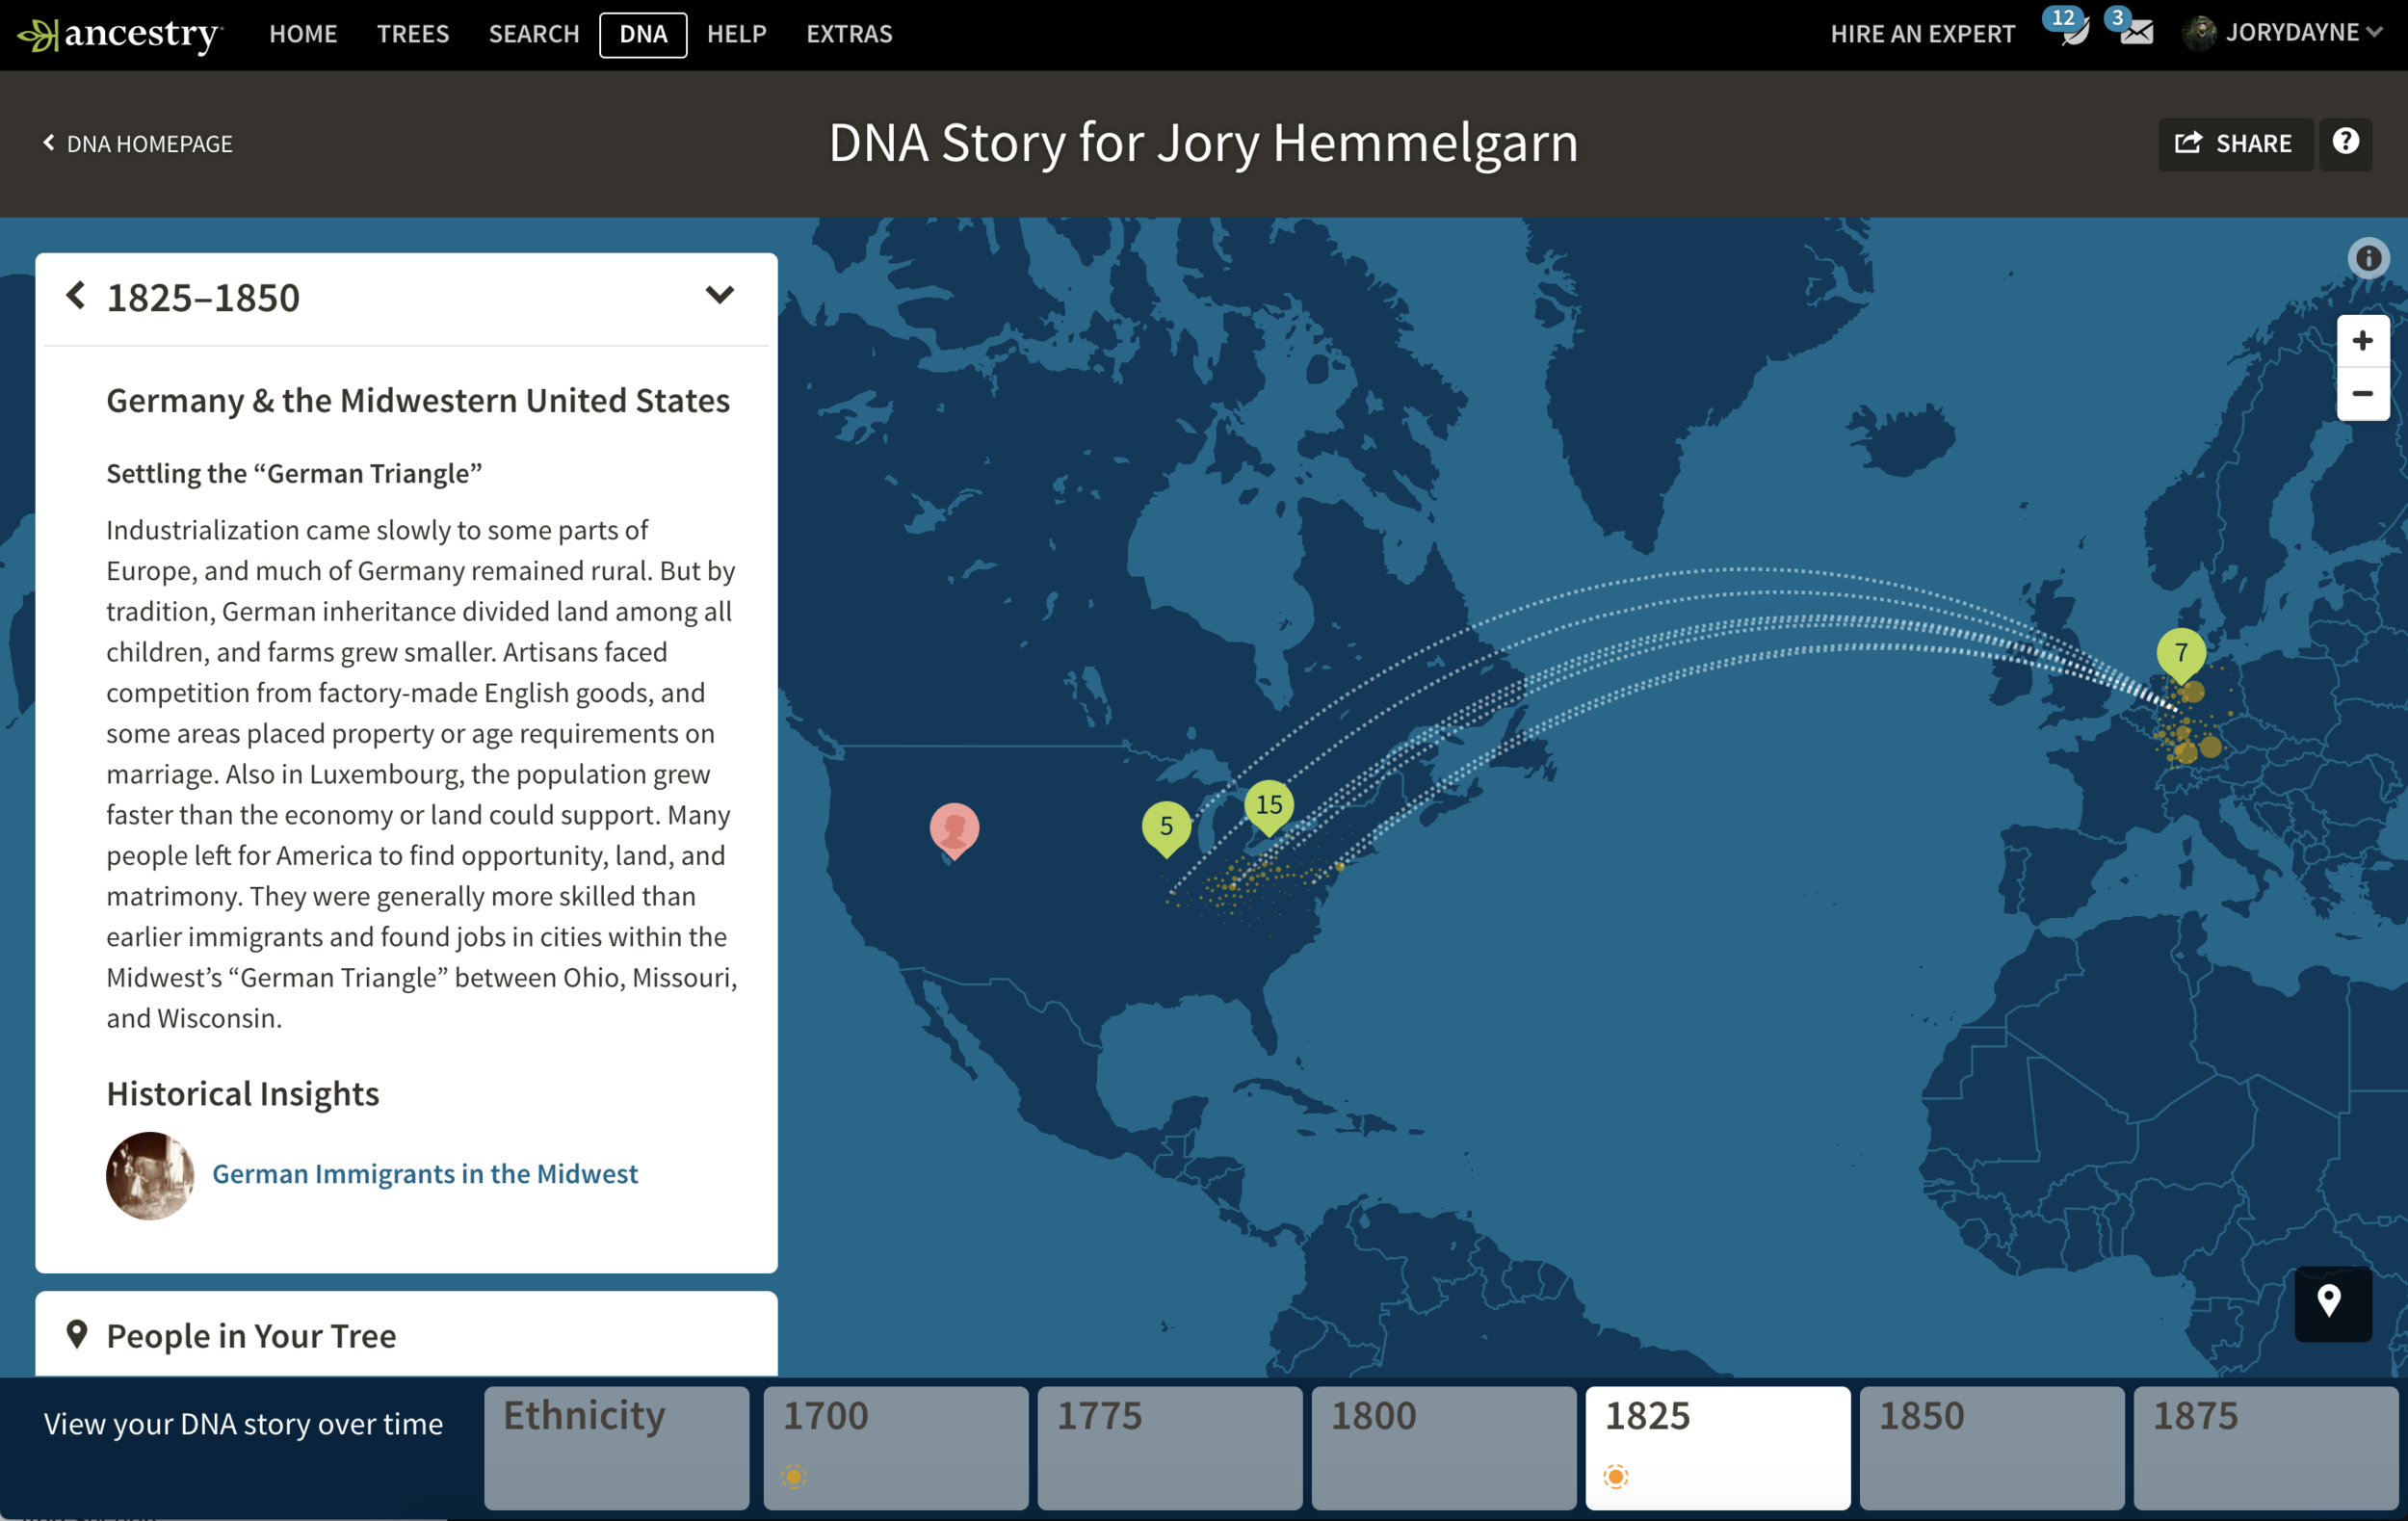
Integrated Genetic Data & Family History Content
V3
Though I was not present for these iterations, I think it demonstrates the soundness of our original designs. Little has changed, conceptually, just iterations into better coordination between the canvases. I am jealous of the vertical timeline. It neatly sidesteps the contrary directions of our timeline (running left to right) and the predominantly east to west migration of Ancestry’s largest user groups (people with European or African ancestors).


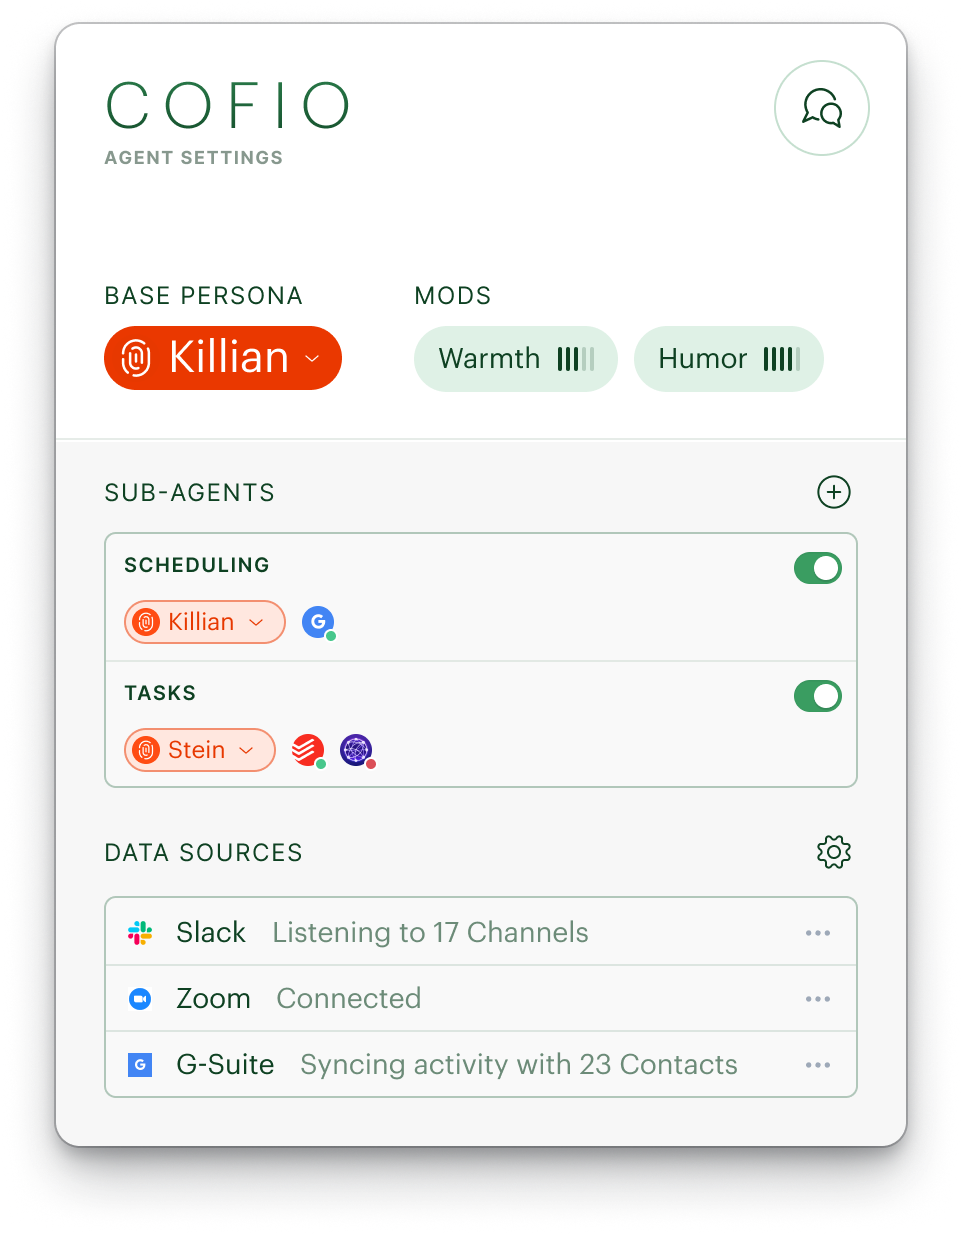
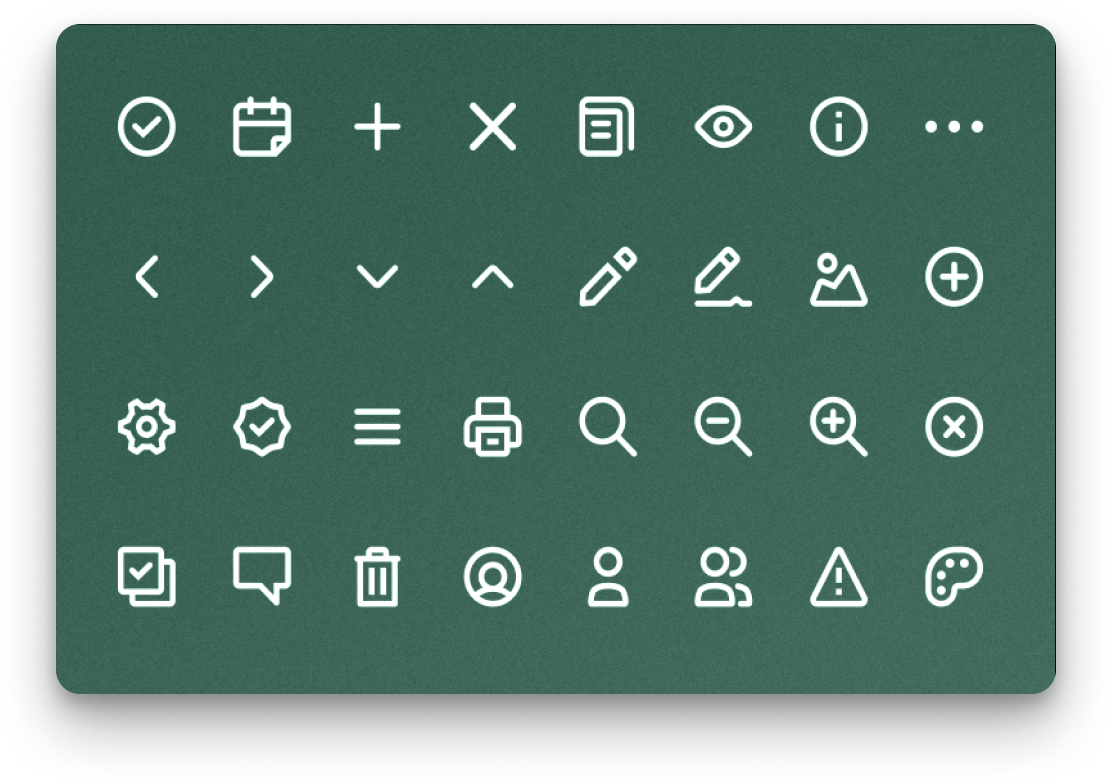
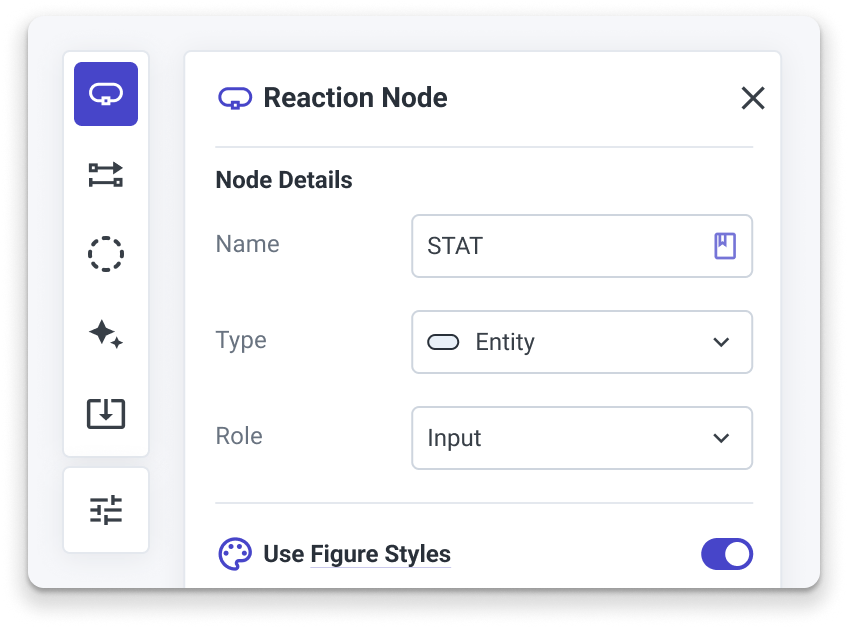
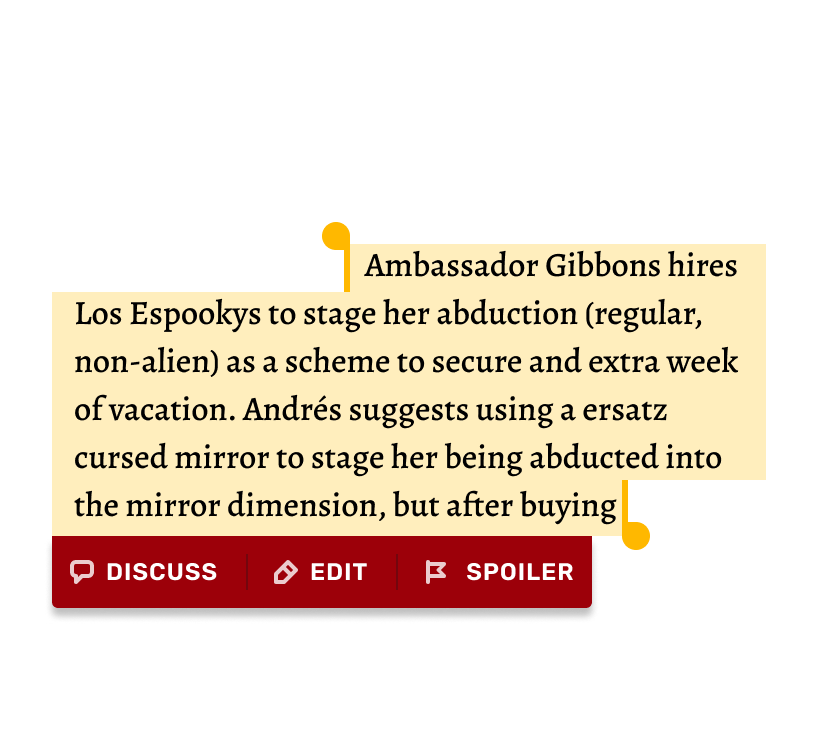
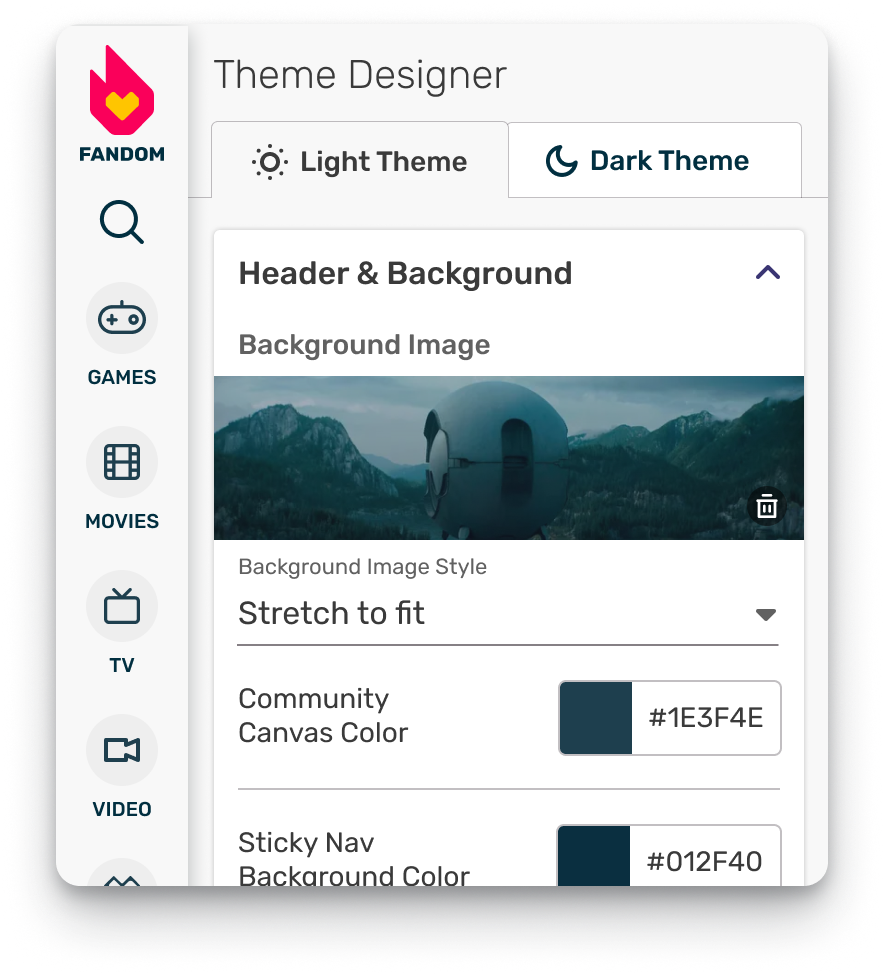
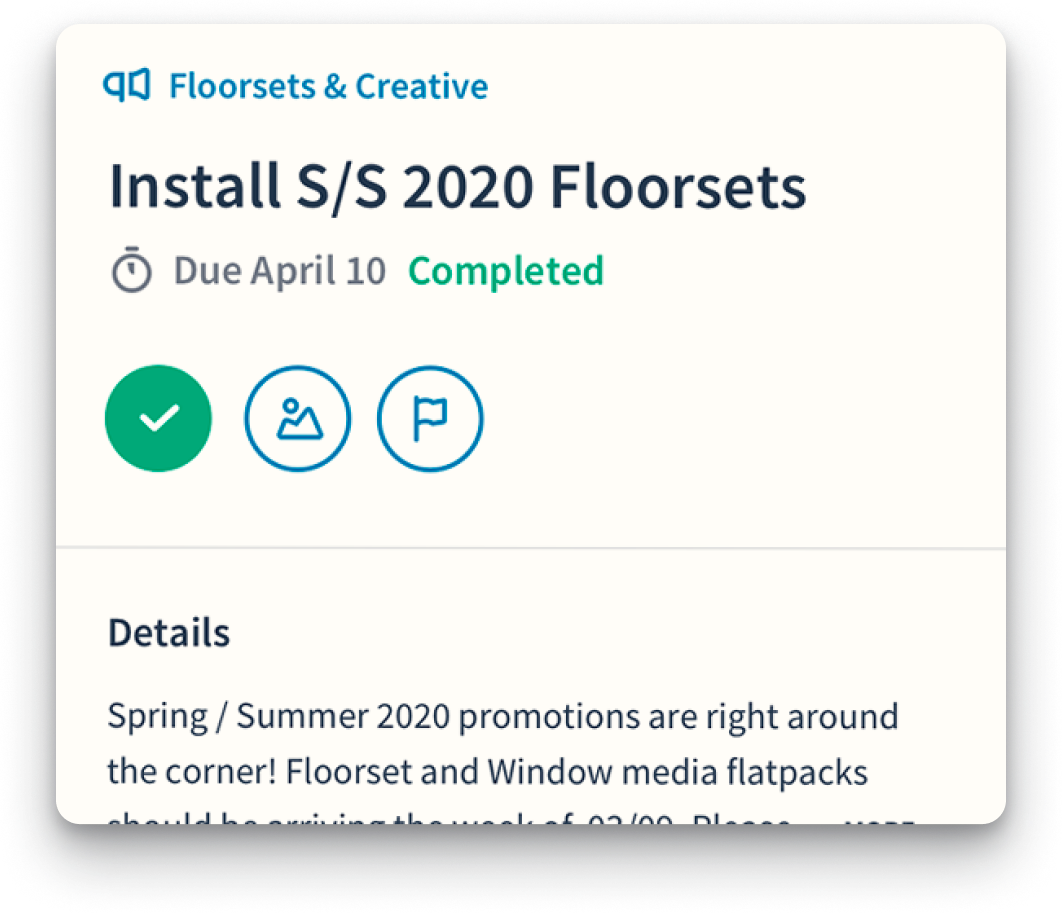
UI Mixplate
Look: interface ages like milk, but here’s some context-free eye-candy to prove that I know my way around Figma, Illustrator, et al.


︎︎︎︎︎︎︎︎︎︎︎︎︎
Bio
I’ve designed products and managed brands for billion dollar corporations and public institutions alike. While I’ve worked in many fields (editorial, brand, art direction, photo & video production) I have specialized experience in developing and shipping multi-platform digital products
Read More ︎
Contact
︎ hi@joryhemmelgarn.com
︎ 801-735-7697
Here are some keywords of “stuff I’m very good at” for SEO bots and recruiters-on-the-go:
User Research, Product Design, UI Design, Figma, Icon Design, Design Systems, Interface Design, Inclusive Design, Accessibility, A11y, Artificial Intelligence, Large Language Models, Machine Learning, Natural Language Processing, Mobile First Design, Metric Driven Design, Prototyping, Ontological Models, Designing for Deep Data, Adobe Creative Suite, Process Design, Service Design, Collaboration ︎
All content © 2008-2024 Jory Hemmelgarn